CAT 1998 — DILR Question 22
Bar GraphsEasy
Passage / Data
Direction: Answer the questions based on the following information.
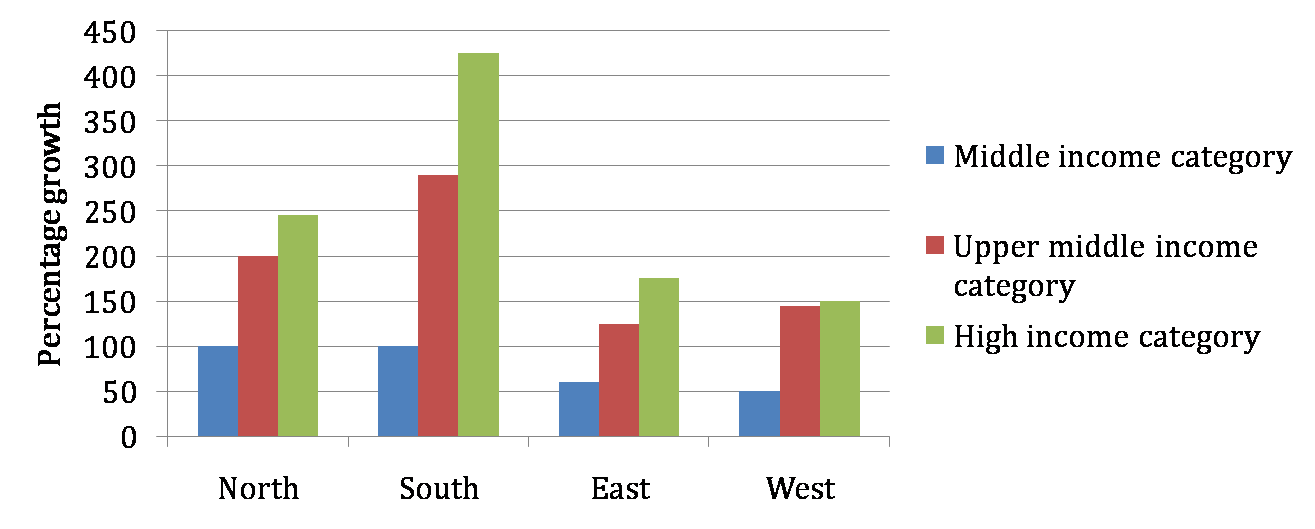
The following bar chart gives the growth percentage in the number of households in middle, upper-middle and high income categories in the four regions for the period between 1987-88 and 1994-95.
 âââââââ
What is the percentage increase in total number of households for the northern region (upper-middle) over the given period?
Answer & solution
- A
100%
200%
- C
240%
- D
Cannot be determined
Solution
It is very clear from the graph that the percentage increase in total number of households for the northern region for upper middle income category is 200%.