CAT 1998 — DILR Question 36
Bar GraphsEasy
Passage / Data
Direction: Answer the questions based on the following information.
In the following chart, the price of logs shown is per cubic metre that of plywood and saw timber is per tonne.
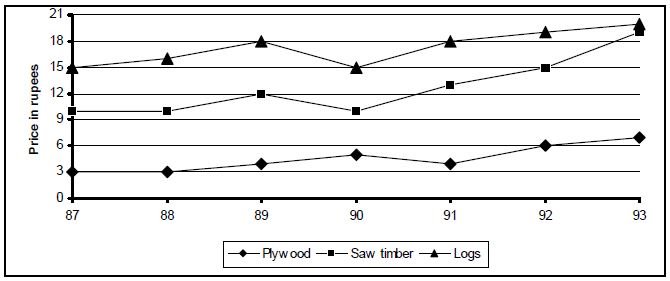
What is the maximum percentage increase in price per cubic metre or per tonne over the previous year?
Answer & solution
Correct answer: 50%
- A
33.33%
- B
85%
50%
- D
Cannot be determined
Solution
The data can be represented in the following table.
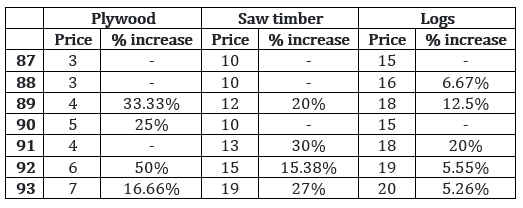
Thus, we can see that the maximum increase is 50%.
Related Bar Graphs questions
- Which region showed the highest growth in number of households in all the income…
- What was the total household income in northern region for upper-middle class?…
- What is the percentage increase in total number of households for the northern r…
- What was the average income of the high-income group in 1987-88?…
- The ratio of total income for the high-income category to the upper-middle class…
- The average income for the northern region in 1987-88 was…